By understanding lens design limitations, it can be much easier to select the right combination of components in order to optimize an imaging system.
Edmund Optics, Barrington, New Jersey
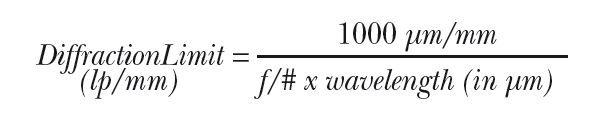
Every lens has an absolute upper performance limit dictated by the laws of physics. This limitation is controlled by the working f/# of the lens and the wavelength( s) of light that pass through the lens. Known as the Diffraction Limit, this limitation is given in line pairs/mm and determines the theoretical maximum resolving power of the lens. Even a perfect lens that is not limited by design will be diffraction limited. This limit is the point where two Airy patterns are no longer distinguishable from each other. To calculate the diffraction limit, a simple formula that relates it to the f/# of the lens and the wavelength of light can be used. (See Figure 1)
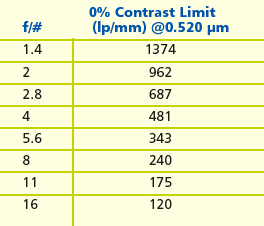
Figure 1. After the diffraction limit (1p/mm) is reached, the lens becomes incapable of resolving greater frequencies. The diffraction limit detailed in Table 1 shows contrast at 0% for given frequencies. These numbers may appear rather high, but are strictly theoretical — a number of other practical factors must also be considered. First, as a general rule, imaging sensors cannot reproduce information at or near 0% contrast. Due to inherent noise, contrast generally needs to be above 10% to be reliably detected on standard imaging sensors. To avoid imaging complications, it is recommended to target 20% contrast or higher at the application’s critical lp/mm resolution. Additionally, lens aberrations and variations associated with manufacturing tolerances also reduce performance. Modulation Transfer Function (MTF) curves are used to determine whether a lens will effectively utilize a sensor’s capabilities and fulfill the desired application’s requirements.
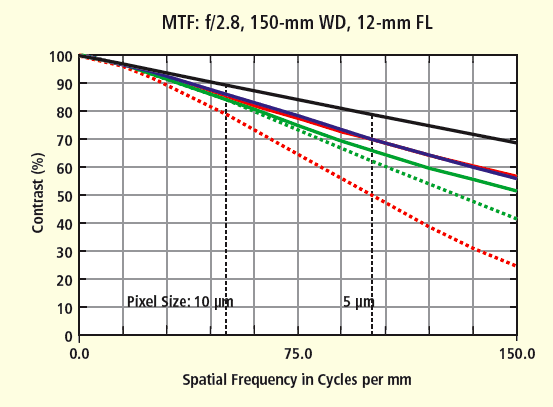
Table 1. The diffraction limit calculated at different f/#s for 520-μm light (green light). MTF curves show resolution and contrast information simultaneously, allowing a lens to be evaluated based on the requirements for a specific application, and can be used to compare the performance of multiple lenses. Used correctly, MTF curves can help determine if an application is actually feasible. Figure 2 is an example of an MTF curve for a 12-mm lens used on the Sony ICX 625 sensor, which has a sensor format of 2/3" and 3.45 μm pixels. The curve shows lens contrast over a frequency range from 0 lp/mm to 150 lp/mm (the sensor’s limiting resolution is 145 lp/mm). Additionally, this lens has its f/# set at 2.8 and is set at a PMAG of 0.05X, which yields a Field of View (FOV) of approximately 170 mm for 20X the horizontal dimensions of the sensor. White light is used for the simulated light source.
This curve provides a variety of information. The first thing to note is that the diffraction limit is represented by the black line. The black line indicates that the maximum theoretically possible contrast that can be achieved is almost 70% at the 150 lp/mm frequency, and that no lens design, no matter how good, can perform higher than this. Additionally, there are three colored lines: blue, green, and red. These lines correspond to how this lens performs across the sensor in the center (blue), the 0.7 position at 70% of the full field on the sensor (green), and the corner of the sensor (red), respectively. It is clearly shown that at lower and higher frequencies contrast reproduction is not the same across the entire sensor and, thus, not the same over the FOV.
Figure 2. MTF curve for a 12-mm lens used on the Sony ICX 625 sensor. Additionally, it can be seen that there are two green and two red lines. These lines represent the tangential and sagittal contrast components associated with detail reproduction that is not in the center of the FOV. Due to aberrational effects, a lens will produce spots that are not completely round and will therefore have different sizes in the horizontal and vertical orientation. This size variation leads to spots blending together more quickly in one direction than the other, and produces different contrast levels in different axes at the same frequency. It is very important to consider the implications of the lower of these two values when evaluating a lens for a given application. It is generally advantageous to maximize the contrast level across the entire sensor to gain the highest levels of performance in a system.
By understanding lens design limitations, it can be much easier to select the right combination of components in order to optimize an imaging system.