
Collecting “in-the-field” information about crop conditions is difficult, or even impossible, when there’s a pandemic and you can’t travel.
NASA’s observations from space are filling in the data gaps and providing a full picture of how unpredictable factors like COVID-19 are impacting the food supply, as well as agricultural markets and the supply chain.
"It is important to understand that 'food supply' goes beyond just crop production," said Michael Humber, Assistant Research Professor at the University of Maryland and data lead at a NASA program called NASA Harvest. "The supply chain and agricultural markets are vulnerable to the impacts of COVID-19 as well."
NASA Harvest , led by the University of Maryland, is the agency's Applied Sciences program on food security and agriculture. The consortium includes scientists, researchers, and other agricultural stakeholders from more than fifty institutions around the world.
NASA Harvest pulls data from space-borne satellites to map crop yields and provide a picture of agricultural production — an especially important visual when events like natural disasters and pandemics impact a food supply chain. Responders can use the data to find the areas in need, and provide assistance.
In recent years the number of spaceborne sensors has increased rapidly as the European Union (under the Copernicus Programme's Sentinel missions ) and several other governments have developed new sensors and spacecraft, and distribute much of the data under an open data policy. The private sector, including companies like Planet and Maxar, is leading the charge in developing constellations of high spatial resolution satellites — imaging at 4 x 4 meter pixels or better, in some cases.
"The variety in data sources means that now we can combine optical data with radar data in order to reduce the effects of cloud cover, and we can use high resolution imagery to identify field boundaries and identify variations in crop health and yield at the sub-field scale," Humber told Tech Briefs.

Humber coordinates a small team of geospatial applications to create the agriculture data images, designing and developing processing systems, spatial databases, and front-end interfaces tailored to the needs of users around the world.
"Under the NASA Rapid Response and Novel Research In Earth Science initiative, we are currently developing a new dashboard that will allow users to combine data from NASA and other NASA Harvest partner organizations to start to understand some of the more complex issues that COVID-19 has caused concerning the food supply chain," Humber told Tech Briefs.
Although the dashboard is not ready for demo just yet, the overall partnership of public and private organizations at NASA Harvest is intended to encourage the adoption of Earth observations data for cutting-edge research and to provide timely information for informed and responsible decision-making.
In a short Q&A with Tech Briefs below, Humber explains how the data pictures have been used to help communities impacted by unexpected events, from droughts to pandemics.
Tech Briefs: How is NASA Harvest data especially valuable during a time like now, when we have a pandemic and the food supply is potentially being disrupted?
Michael Humber: NASA Harvest focuses heavily on remotely sensed data acquired by spaceborne sensors. Although we would like to have “in situ” data collected from the field to learn about crop conditions, conducting a field campaign is not possible in much of the world right now due to travel restrictions within and between countries. Remotely sensed Earth observations data is being used to fill the gaps and provide some level of understanding of the planted area and crop health in areas that are currently off-limits.
COVID-19 is influencing supply and demand. The drastic reduction in demand from restaurants and schools. for example, coupled with increased demand at grocery stores, have sent ripple effects through the logistics sector. COVID-19 has directly impacted labor availability, as have restrictions placed on the mobility of migrant workers – this is particularly problematic for high-labor crops like fruits and vegetables that require many workers in the field.
{youtube} https://www.youtube.com/watch?v=zrDggm-8IXY {/youtube}
Under the NASA Rapid Response and Novel Research In Earth Science initiative , we are currently developing a new dashboard that will allow users to combine data from NASA and other NASA Harvest partner organizations to start to understand some of the more complex issues that COVID-19 has caused concerning the food supply chain. We are also engaged in the GEOGLAM Crop Monitor reports that provide monthly information on food production for markets (Crop Monitor for AMIS) and food security (Crop Monitor for Early Warning) and, in the latter case, highlights the food security impacts of COVID-19.
Tech Briefs: When were these kinds of "spaceborne sensors" first used to create agriculture visualizations?
Michael Humber: NASA, of course, has a rich history in developing Earth observing sensors, and the use of these types of data for agricultural monitoring dates back several decades to the LACIE and AgriSTARS programs. Historically we have used optical sensors that detect radiation leaving the Earth's surface in the visible, infrared, and thermal wavelengths, and these measurements were obtained either at coarse spatial resolution (250 x250 meter pixels or larger) with daily revisits or at moderate resolution (30 x 30 meter pixels) with 16-day revisit times.
Tech Briefs: What are the most effective data visualizations?
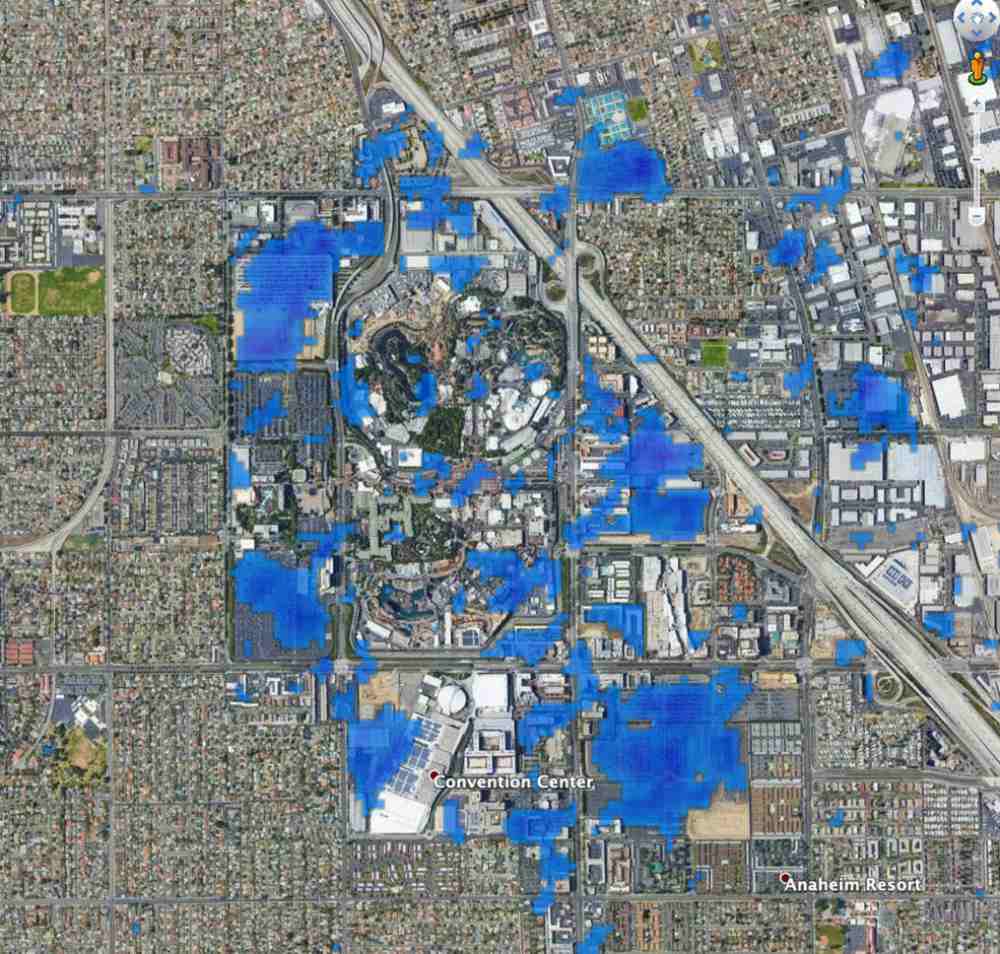
Michael Humber: Over large areas and long time series, an effective technique is to visualize the anomaly, representing the deviation of the current conditions from the average conditions.
For example, if we plot the Normalized Differenced Vegetation Index (NDVI; an indicator of crop health and development as well as a decent proxy for crop yield) at the peak of the growing season and compare the value to the 5-year mean at the peak of the growing season, we can easily determine whether yields should be higher or lower relative to normal. Visualizations like this work well for users who are expert crop analysts, but stakeholders can have a wide range of data and information needs – statisticians and economists may prefer tabular data and graphs, while geographers might favor maps and broader audiences benefit from a narrative explaining the data and its interpretation.
Tech Briefs: Can you give an example of a specific visualization?
Michael Humber: A vegetation monitoring application prototype called the "Global Agricultural Monitoring (GLAM) System" is used to monitor crop growth progress and crop health based on imagery acquired daily (composited to 8-day intervals to reduce noise) by the MODIS sensor (See the image below). While UMD has been developing the system for more than ten years, this particular example is a prototype we are using to test serverless cloud architecture as NASA begins the process of moving its Earth observations assets to the cloud. The system has been used by several organizations, particularly ministries of agriculture, to operationally monitor crop conditions because we are able to provide the data in near-real time, i.e., less than one day after the satellite overpass, alongside tools that can be used to create figures and export data into external workflows.
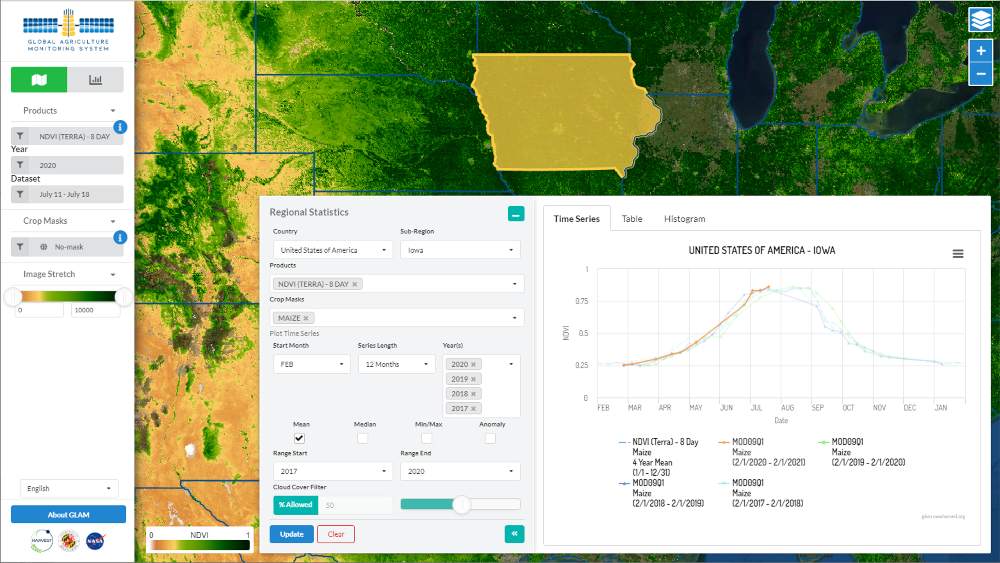
"Global Agricultural Monitoring (GLAM) System" is used to monitor crop growth progress and crop health based on imagery acquired daily from the Moderate Resolution Imaging Spectroradiometer MODIS sensor, launched into near Earth orbit in 1999.
Tech Briefs: Once you have a visualization, then what? What kinds of actions can be taken to help people?
Michael Humber: As an applied sciences program, a goal of NASA Harvest is to provide operational and actionable information to agricultural stakeholders. Some examples include:
- Sergii Skakun (UMD) has worked with Planet to map crop yield at the field scale — this helps identify parts of the field that are performing poorly, which can be due to poor drainage, faulty irrigation, or other issues that can be remedied by the farmer.
- Researchers Jillian Deines and David Lobell at Stanford University are exploring the (positive) effects of conservation tillage on corn yields in the US.
- The Agricultural Estimations division of the Buenos Aires Grains Exchange, led by Esteban Copati, frequently uses data visualizations from NASA Harvest systems to monitor flooding and drought in Argentina and uses this information as part of its determination of national crop production estimates.
- Work led by Catherine Nakalembe (UMD) was used to identify a drought in its early stages in Uganda. The information was used to dispatch food aid proactively rather than waiting for the production shortfall to be realized, saving money and preventing hunger.
- The GEOGLAM Crop Monitor for Early Warning brings together humanitarian aid organizations to combine their information in countries susceptible to food insecurity. The reports are a summary of the consensus among organizations of the crop conditions and have been referenced in joint statements on food security crises.
Tech Briefs: You mentioned that a dashboard is in the works that will help users understand the impact of COVID-19 on the food supply. How will that dashboard work, in practice?
Michael Humber: The goal of the dashboard is to bring together as much information as possible about markets, typical trade flows, evolving policy, and other external factors that can disrupt supply. As an example, Egypt is the world's largest importer of wheat, and much of the imported crop comes from Russia.
Our dashboard will allow a user to identify how much of the Egyptian wheat import typically comes from Russia, overlay that with price information, see recent export policy changes from Russia, and monitor the condition of the crop using satellite data and international reports on crop health. The effects of the pandemic are implicit in some of these data layers, like policy and prices, but we will also working with other organizations to provide data on the distribution and number of COVID-19 cases that can give users an idea of whether labor will be impacted.
Tech Briefs: How do you work together with NASA? What is a typical day for you?
Michael Humber: NASA Harvest is fortunate to be in a unique position that bridges the goals of NASA and the needs of agricultural stakeholders, between data producers and data users. By working closely with NASA, we can constantly communicate and re-assess the needs of the various communities involved. This also allows us to stay up to date with the latest data and technology (for example, NASA’s shift to cloud storage and computing). In day-to-day operations, matching users with datasets, tools, and providing the training to use them is the goal for our development team.
What do you think? Share your questions and comments below.
Transcript
00:01:06 so this is what gene for example referred to this topic apart we know it's a sort of club that was established because it's a very it's a interesting part of the globe giving the typology of seasons of drops of Highlands lowlands so we saw this frequency sometimes are quite strong so that the discussion becomes showing the lecture a very interesting when both the analysts
00:03:52 thank you so much for that response and I'm going to go to Kenneth just something about the commentaries blending the importance of coordinates them very dismissive East Africa Club there's so many players in the Rita this is that's my question why does the other kind again of regional so we have the natural avoid is ongoing in East Africa
00:05:23 they couldn't be directly to why what do you see is the value of happiness this level we do have utilization when used to give an expat tax mandate well the bloody hopelessness in the original possible we normally have a multi-party it's what's our party to put it in big commissions assume $90 but we have so many different artists he stopped it have been having of London
00:05:55 vibrations and in the problems five most production is there and hostility reproduction so there's a lot of trade that moves from the countries that high producing like Uganda one that sonya and they put their brains to cleaning so Kenya's booty energy with lower production so your friend is a lot of trade within the countries there so what the original crop monitor has
00:06:21 brought because there it's not just looking at appropriations it's looking at the marketing permission by our partners looking at deployment information for my organization forecast ten-day forecast might be focused so it's a by having a regional viewer may be able to give information that can be acted on by one country to take advantage of what is happening in
00:06:48 another country like excess surplus production low production good praises great prices in one country or another so that's the advantage of this regional we got this on a regional network because we have these trade tariffs areas that are being worked on and being removed so it's just to enhance a regional food security component of it which I think coordinates supported by
00:07:20 its various partners my question my question to you is how to ensure that this capacity is sustained how to make sure that with technology what is it packs approach to this it was we reinvest from any policy as an organization and also technical analysis we find other organizations that are wasted from their mandate built in private like appropriate cancel
00:07:55 or entire inter-country organization international organization like video settle for marking it's already very strong in capacity building so what we do is I get into collaborations of partnerships and they provide that cooperative training within the application very opulent gazelle they're working for poodles they are working on a positive
00:08:17 building we are working on monitoring of pests and diseases so to make sure that this product remains relevant we have to continuously keep expanding our partnerships and even strengthening the light power witness artists for example we just technical exchange but there's also information exchange as we're getting from an ash in the world so it's continuously looking of key partners key
00:08:45 collaborations and sustaining them by inviting them into information generation I mean the meetings that you generate the information together be it online beta in our greater output forums so it's a many levels that we have to make sure the partnerships and the capacity is sustained well the countries we just have people training as you find one big challenges
00:09:09 are limited resources but what we list up to which we are training new properly temporal operators in the countries because they that field information transfer them so it's a continuous engagement cycle from decision-makers resource providers technology providers but continuous engagement thank you so much and a way to switch gears a little bit
00:09:41 I know that you'll notice that both the program which doing a lot of places that in conflict and my question to you is how theirs will be part of this community but then how we increase access to organizations changing you know some of the things of what is doing what are some things that you're doing to investors in change
00:12:51 many of us we tweet right here to spend access to and makes hard labor thank you so just put thing before I go arey I just wanted to fall off with with you Tim but some of there is you were working working as well areas and working with farmers a question I have for you is how do you post it how do we ensure that this top level on from you so relates appears on just the same way
00:15:13 I was getting information from the field you know from the texted she needs incentive it's going to become how them how do we ensure that I think that this dilemma is twofold I think in a lot of situations the costs are beyond the reach of most governments and I think that particularly walks through in fragile states where the government simply doesn't have access in
00:15:40 some of the less restrictive employment I think there are a couple of different pathways we can think about that will close that loop one thought is to link that kind of round trip data of the collection of data from the ground that validates the video data and then passes concrete recommendations about the farmers would it be that are getting created in to the actor level in supply
00:16:02 chain that's a supply chain that has from the capital all the way down to villages where the farmers are I think that there's an incentive for that supply chain because it brings the right products the right people at the right time which you can also then combine that with the David process and built those two men together a second pathway I think it's like looking what's going
00:16:24 on now in West Africa and over the last year the loss has changed a lot of the regulatory departments that govern how cooperatives can play in the agricultural market so there's not much more freedom for cooperatives to intersect directly in the ECOWAS market and I think that offers other than a good analogy that if cooperatives are now formally being built in
00:16:52 Arkan economy why cannot we look at ways to certainly formulate including cooperatives who are oftentimes the point of access through which farmers can get information into the early morning data management systems so either using the conduit or integrating them into the private sector of aggregate supply chain might be two ways to do that so my next question sort of
00:17:19 ties whatever this to you Gary the question is how do we move over in the morning how many more frequently move every morning to decision how do we do it every time how does how do we get is there any one information basis well I think I can talk about an experience that we've had over a long period 35 years doing it and trying to get try to
00:17:52 make a difference in food security with early learning information I'd say it's been fairly difficult to tell but we had an influence and in some of those periods typically what we did was we took products from the community and simple here some of them that we we did ourselves we tried to make sense and in the spirit of kind of a scientific investigation
00:18:18 we would put together our thoughts and our analysis and we'd walk into the office of food for peace or others that would say here it is it's evidence and we drop it on the desk and we'd expect that they'd look at the evidence and it would drive the decision and I think it was fairly difficult to say with any convincing tone that that was making a huge difference until about 11 10 11
00:18:43 years ago we were invited to come in on a regular basis to the monthly nomination meetings that occur in four piece so they have 300 million dollars that they have two three three billion dollars down programming annually and so they can't program them all in the first month of the year because there are going to be other problems coming up later so they have to have a
00:19:08 system for just determining when they allocate amounts of foods tariff of assistance to protect food security and that is a fairly sophisticated algorithm that not only looks at that needs as expressed by different parties but also the patterns of responsible partners the acceptance of governments the cost of transport the availability of global partners so there's a whole range of
00:19:38 features that they have to go through twelve times a year at least to determine when they're going to allocate and obligate and move resources out to particular problems and basically before we started working with them I'd say that they were taking general snapshots of our data and Samba looks like maybe Ethiopia will be a little bit worsen and then factoring that in but as we
00:20:06 developed the dialogue on a monthly basis where you sit in front of the people who are actually making the decisions and they're able to ask questions and challenge and add in in providing context I think that not only does the information become richer but you also and I think we've referred to this multiple times and the meetings over the last day or two there's a trust
00:20:32 that develops that you've done your hundred and on both sides we become aware that these people are informed consumers we have to up our game and I think similarly in the best case they learn that we're pretty good at what we're doing and we have a basis for their saying and so it's it's not just a better situation it's it's a qualitatively more informed and more
00:20:58 trusting relationship that develops and really plumbs the value of that in a way that wouldn't have happened otherwise so I think it's really what I'd say is the the lesson our lesson which I think should probably be your lesson as well as and I think this is one of the guiding features of harvest you've got to be talking with your end-users and sometimes it's not just
00:21:26 talking it's got to be much more than that it's participating it's learning to trust it's giving them a reason to trust you as well and that's the real lesson of how in my estimation we don't have many good metrics for the value of the information we provide but you know from the reaction of our users in that sense we feel like we're providing much better information through this relationship
00:21:54 that we use to us I think maybe with you because I mean for mine from my experience working in Eastern Africa one of the most important thing is just it's almost as if you have become embedded with the you end-user understand how they work and how they function and form a relationship then they expect to trust you because if you show up for this new tautology that's undermines everything
00:22:21 we've been doing it is a time it would work so I wanted someone to work Murray has a continent we have a interesting situation you know that need to link the early work with their reaction is becoming more and more popular and let's say when we do this type of exercise FAO 11 it works so we know what's going on in different parts of the globe so we do this type of a location
00:23:04 decision and we can start some a reaction in some countries what is important is to move down at country level so to engage in discussion with them because to level it becomes more difficult it becomes a sort of I don't know if it's gambling or effect or dealing with the risk so we started today the discussion with the pace even gamba when we had a
00:23:33 wise decision maker that decided to have enough evidence to take action and solve the problem immediately but in other cases maybe the evidence is not so strong policy makers are reluctant to take a decision that may become unpopular or maybe consider it wrong or exaggerated so the reaction sometimes it becomes not so early because more rarely more is the risk for someone to be wrong
00:24:05 so again that level of international organization it's evident we know in follow now there are so many studies saying that for every dollar invested in early action you say by the many thousands of dollars in post action so well know the donor level that it's better to act soon and we go down to level difficulty ones that yeah I would just want to underscore you know this
00:24:39 idea valuable regular and frequent communication among partners organized around the common cat's question it's just was very very powerful very very valuable I've seen it work with the prop monitor if the warning Gary is a good example with the food assistance outlook reads I've seen work with not really wanted systems in the West for us it's it's a way of working
00:25:07 that's experiment so I have another question given a discussion when where should our community moving to like we supposed to do next what are we supposed to but are we supposed to do now we can meet the needs is where well in the spirit of what I just said I think that it really is a product of dialogue so we do need the sustained dialogue as we saw in other meetings
00:25:41 when we talk about needs you know the needs are so difficult to to put in one basket or another or even ten baskets everybody has different needs in our meeting yesterday around the group we were talking at different levels that different objectives we had different data sets we didn't need different outputs so I think you know the real essential thing is there is that these
00:26:05 what we do next is really determined by a dialogue a trusting dialogue between people and so I'd say that that's that's basically the overriding need that we have in this community is to have more platforms like harvest where you can find different skills sitting next to you and you can define your questions as well as you can and have them redefined thoughtfully by other people around you
00:26:40 who are then willing to follow up and translate your needs into different products so I think that's I'd like to say again as I've said several times not only about harvesting such a nice idea and nicely implemented but we need the courage and the insight that NASA had to be able to do something like this I mean that's just really outstanding for that I don't mean to
00:27:09 [Laughter] well coming from this community that is to monetary misconceptions but not from us that is a regional coordination that is on policy and also a political action but through the government's yet what we most definitely give we don't preach even not for them but here comes national governments that are snowy up
00:27:48 taking this information and actors as well at the regional level what we do is still push for action that pushes for coordinated response for example if from fews net assessment we had a systematic PARCC assessment you are getting at critical levels of food security you invoke countries that they have to have permitted a certain percent of their budget in disaster response and among
00:28:13 them is food security and you push that through the ministries and so anytime we are meeting with them through a process and we take them through the technical part of the process in declaring food insecurity and we call for press conference together and release that information all countries are mandated to invoke the disaster response option which is a coordinated action in all the
00:28:38 countries on moving to us that doesn't helping countries better kiss responding to food insecurity thank you so much I have one last question especially know who's worked better as partners and Gary spoke about us for one to hear what it's giving you the word Confederates - can we communicate better when Chris Medford David which so ties into the PPP that from this morning and
00:29:15 from the succession being a researcher what was new models and new motivation studying I would say hi what is that some of them's been doing what what is the significance of that okay maybe I'll try to answer the partner I mean it's related to the partner question which is I felt like I was a pretty terrible partner as an academic for a lot of exciting potential partners that we
00:29:43 could have had so when we publish it for example lots of interest and some of its on the humanitarian side some miss certain inside that's very important but if you from my perspective if you look at the history of places that have gone from the included security security the private sector has played a huge role a very heterogeneous system there are a lot of small commercial farmers that
00:30:15 there's a lot of investment between you and there's a lot of exciting stuff going on there and I just I think that's where a lot of the action will lead and we wanted to think of something that could really help catalyze accelerate that we had this opportunity with the Rockefeller Foundation coming to us and asking how can you scale the work that you're doing for a bunch of users and so
00:30:35 we pitched this idea to them that it would have to be something outside of the normal sort of constructs because you know I'm gonna speak for myself we're pretty good at you know science and innovation and training sides we aren't necessarily good engineers or not so we could sales people and there's just a whole lot more capabilities that I didn't feel like we did have or could
00:31:07 build very easily we did sort of the traditional structures that so luckily the Rockefeller Foundation it's really about enabling let you think again said to make sure that when we're trying to collaborate new partner we know exactly what we're doing I think rather than during the tackle me my arm elephant breaking it down into what specific part of the
00:31:39 elephant are we here to talk about and then try to take this in bite-sized pieces where we know we can create tangible progress rather than trying to tackle the entire deviations the second thing I would say is to put more of these discussions that take place in the government in a sentence this is maybe not the most important thing but I think it's an important thing and it's
00:32:13 something that I don't think anybody's doing that and that's the question of data ownership you know I think we shot ourselves in the feet back in the 80s with certain meetings bamako and others where we said you know the weather service should should pay for itself by selling its products and I think we had a similar kind of situation with health services that health
00:32:36 services shouldn't pay for themselves and what ended up happening was data that acquired of value public common data in databases became translated into economic values and people then were not able to share their data without selling it and I think what we need is we need somebody to help lead us out of this jungle of uncertainty about through omens certain data sets of common global
00:33:05 good and I don't know what it takes it's made may be much more than a legal issue but there's so many to help us clarify many technicians at Ministry levels where they said I'd love to give you this data because it makes sense but if I did it and somebody above me found out I would be in a bad spot so I think sometimes it's you know it really impedes partnership
00:33:32 and it really impedes progress as well yeah no I was thinking more than the data it's also who does what sometimes we give for granted who is able to do which type of analysis and who can benefit from a collaboration so now I'm learning from love you know I'm I am from a a group of economists so being parachuted into an earth observation meeting obviously I would like to go
00:34:11 back home tomorrow and start making connection with a lot of you and do things in a different way and in a better way obviously there is the danger that I go back and I continue to do what I was doing before you know I will be overwhelmed by Ricki and I also understood that a lot of people they do not know what we do in Rome in the
00:34:35 global information and they're the warning system and this can be useful also for others so sometimes I have to think that maybe there is too much so it's difficult to keep track who does what and where you can shop and do things so I'm sure there are possibilities to do things better it's good to to have a guide in the jungle agencies services
00:35:19 trying to get also to the car to sell to flexi the round of different applications in research beach well I'm just to pick up on that thought I could say that in use remember very very fortunate them that we not only have partners that are fully engaged in the operational aspects the university departments we capture latitude in their work plans to explore and investigate
00:36:12 and research those problems that we are confronted with regular basis initially but for which we just don't have time as operational people to look into and because they're tired of the fews net family partners they have that regular and frequent communication and exposure or to the operational processes such that when they undertake some research its well informed in terms of what's
00:36:44 needed and very often those directly into practice once the solution has been obtained so consider ourselves very lucky in that regard because myself I've been plenty of experiences researching something and publishing it and then that's the story Oh for me to be very muscle we were to move forward to the type of a tree doesn't have its dessert we need to
00:37:24 yield assessment it's good to hear I mean creation for customer and it's good to hear is good to interact with them people here who are doing that with small scale which is our setting mix agricultural areas which is the most business setting so he leaved us and we needed that like yesterday but it's good to hear that possibility and the other thing that we need is unlike most of the
00:37:53 panelists here wearing a very well structured organization framework we are coming from an area that we are responding to drought as the primary focus of the preposition now we are getting into alimony and my director is here to worry the life of how is being restructuring the organization to have more money warning information the more action so that's one area that we
00:38:16 really appreciate support from people who've done well and other people I mean organizations that already in a faceted process it we're promoting the action a little bit which is now even becoming a demanding provision we are having counties governors likes to ask how can we respond to their what are you giving us how can you prepare terms of our trainees in terms of nice to accompany
00:38:44 prepare so where do you get such I use this demand in such a position to thank you for sharing your experiences of the audience I think everybody appreciated this most going to comment about what Tim said to be certain that I was one of them very lucky yes what I did for my research two actions my research my community it is what helped design the disastrous
00:39:21 financing program that was very fortunate however it's very much thanks together and I think [Applause] you