
Today’s micro-imaging analysis software systems provide users with a module-based approach that allows imaging and measurement to be customized to specific workflow environments. This type of interface flexibility also enables higher levels of automation and standardization — facilities no longer need to rely on small groups of microscopy experts to handle their imaging and analysis tasks. Today, guided, automated functionality based on specific software modules allows larger numbers of staff members to manage the creation, analysis, and distribution of material images. These modules are particularly useful in metallography applications, guiding users through every step of the image analysis process.
Specialized Metallography Modules
Today’s module-based imaging software can be purchased in a variety of set-module packages, or specific application modules can be purchased as needed. Designed to allow efficient image capture and adjustment, measurement, report creation, and archiving, specialized metallography modules include:
Particle Distribution Modules
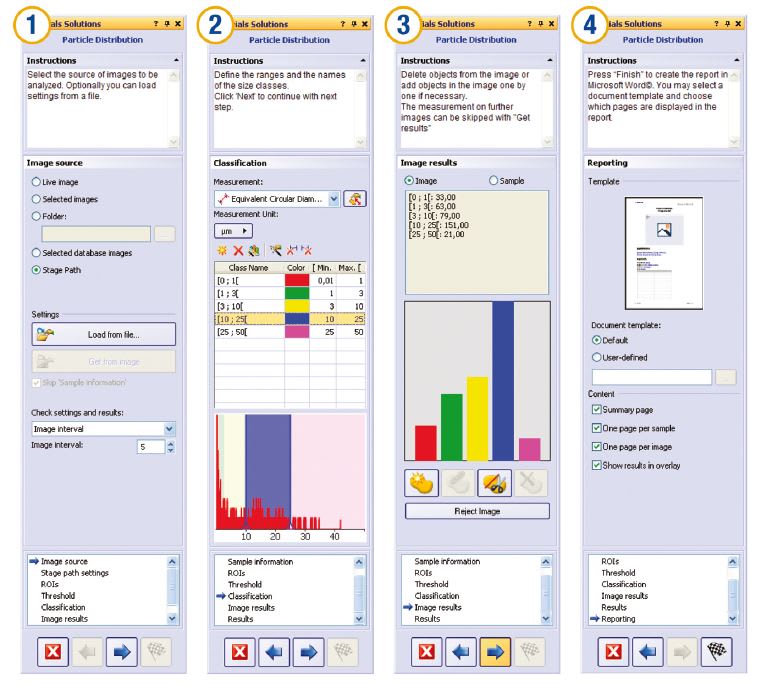
Particle distribution modules (see Figure 1) allow the creation of particle-size distribution histograms from a series of images using different sources (live image, existing images, stitched images). Users can select various types of measurement parameters and produce a graphic representation of particle distribution according to user-defined bins or international standard classifications.
Phase Analysis Modules
Phase analysis modules allow operators to perform phase analysis on selected Regions of Interest (ROIs) including triangles, circles, rectangles, and polygons. Results can then be cumulated on multiple images.
Porosity Modules
Porosity modules are designed for the measurement of pores, whether an area fraction or a number of pores on surface. Designed to automatically calculate pore density, porosity modules also allow the user to select only a certain range of pore sizes in order to achieve the necessary reproducibility.
Grains Intercept Modules
Grains intercept modules assist steel manufacturers in measuring and controlling grain size after cross-sectioning, polishing, or etching steel samples. Grains intercept modules can automatically calculate standardized American Society for Testing and Materials (ASTM) grain size numbers by the intercept method without any time-consuming manual input.
Grains Planimetric Modules
Also designed for steel manufacturers measuring and controlling grain size after cross-sectioning, polishing, or etching samples, grains planimetric modules calculate ASTM grain size numbers by the planimetric method.
Chart Comparison Modules
With chart comparison modules, a live or still image can be compared with standard charts using overlay comparisons. Chart comparison modules are ideal for ASTM grain size number evaluation, nonmetallic inclusion rating, and cast-iron shape class evaluation. They can also be used for the examination of carbide structures in steel.
Inclusions Worst Field Modules
Inclusions worst field modules are designed for steel manufacturers measuring and controlling the shape and size of nonmetallic inclusions (oxide, alumina, sulphide, or silicate) in steel.
Cast Iron Modules
Cast iron modules are used by casting manufacturers to measure and control graphite nodularity to check the mechanical characteristics of their cast products. Nodularity can be calculated by graphite size, shape, and distribution.
Layer Thickness Modules
One or multiple layers of a cross-sectioned sample can be measured using layer thickness modules, which define shapes and automatically measure layers. Layer thickness modules are used for a variety of applications including the evaluation of paint-coating thickness and layer thickness of multilayer materials such as composite plastics.
Throwing Power Modules
Throwing power modules measure the distribution of copper plating thickness in through-holes or micro-vias. These modules guide the printed circuit board (PCB) quality examiner through all necessary measurements needed for determining dimple depth.
Using Modules to Analyze Grain Size in Metals and Alloys
ASTM E112 is the dominant international standard for measuring grains in metallic and alloy samples, with ASTM E112 test methods covering procedures for estimating the average grain size of metals consisting entirely, or principally, of a single phase.
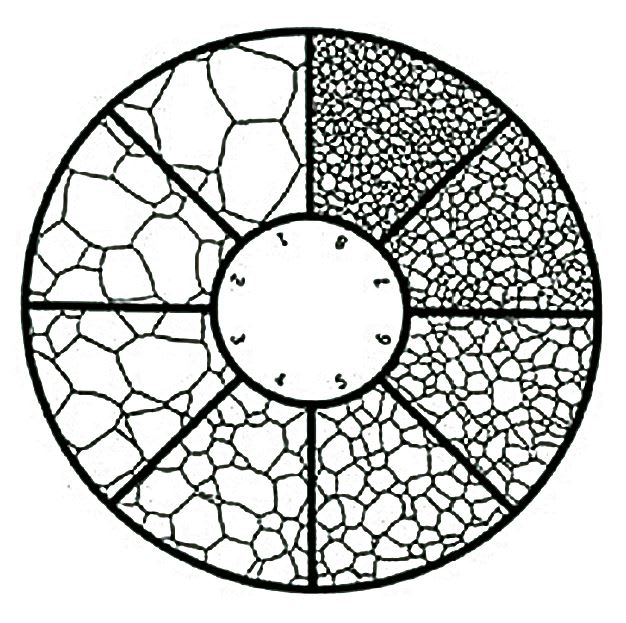
Prior to today’s advanced micro-imaging software, most quality control labs would analyze these grains by performing a visual estimation of the grain size by comparing a live image under an optical microscope to a micrograph chart, usually posted on a wall near the microscope. Or, instead of using a micrograph poster, the operator would insert an eyepiece reticle containing images of predefined grain size patterns into the microscope’s optical path. This way, the comparison would be performed directly in the microscope (see Figure 2).
Since grain size is being visually estimated by the microscope user, both of these methods often lead to inaccurate and unrepeatable results — and results that are not reproducible between different operators. Furthermore, quality control technicians are required to manually enter their results into a spreadsheet or report, providing an additional opportunity for error.
Today, with modular micro-imaging software, operators can use very specific custom software modules to accurately analyze grains in compliance with ASTM E112 and other international standards. Grains intercept and grains planimetric modules provide metallurgical quality control laboratories with fully automated grain analysis, eliminating potential inaccuracies, automatically archiving all data, and generating custom analysis reports.
Grain Analysis via the Grains Intercept Module
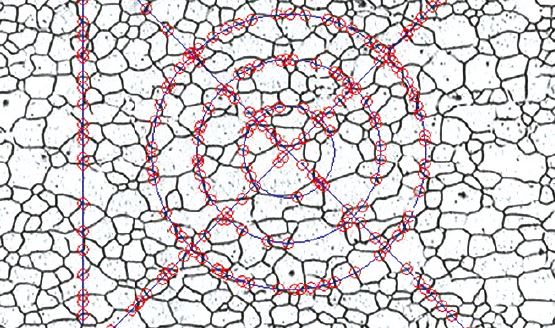
Using a grains intercept module, a pattern (circles, cross-and-circles, lines, etc.) is overlaid on a digital grains image (live or captured). Each time the overlaid pattern intercepts with a grain boundary, an intercept is drawn on the image and recorded. Taking the system calibration into consideration, the grains intercept module (see Figure 3) automatically calculates the ASTM “G Number,” or grain size, and mean intercept length (based on the intercept count and pattern length).
Grain Analysis via the Grains Planimetric Module
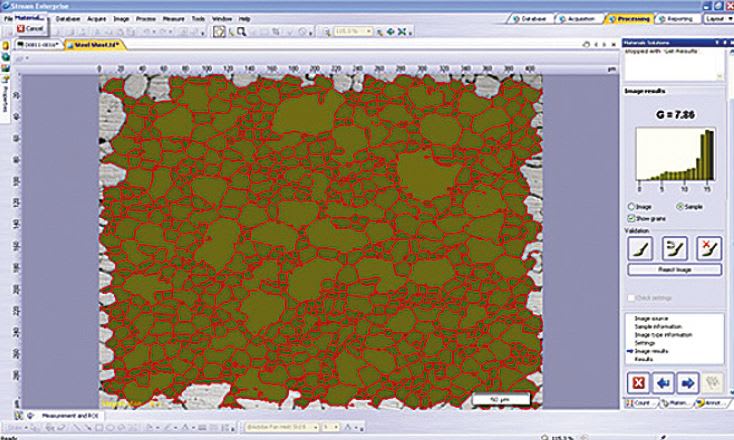
A grains planimetric module (see Figure 4) executes the planimetric grain analysis method, which determines the grain size on an image (live or captured) by calculating the number of grains per unit area. Since all results are calculated internally within the grains planimetric module, uncertainty previously attributed to the human element is removed.
With both the grains intercept module and the grains planimetric module, grain analysis results can be automatically archived onto a spreadsheet or integrated database. Grain analysis reports containing all relevant analysis data and associated images can also be generated.
Specific Application-Based Solutions
As illustrated in the example above, module-based image analysis software gives operators access to very specific application- based solutions, allowing them to execute complex analysis tasks quickly and in compliance with today’s most important international standards. Repetitive measurement is essential to industrial microscopy — modularity provides the ability to choose the interface function designed specifically for the task at hand. Depending on their needs, users can pick and choose from modules designed for their exact application: particle distribution, porosity, grain analysis, nodularity, etc. Each module then delivers advanced functionality built around that application, including fully guided processes that enable ease of use and reliable repeatability.
As module-based software systems continue to ensure consistently accurate results, users will likely expect even more automation from new imaging software packages. Micro-imaging software development is progressing at an extremely fast rate, with auto-measuring and auto-alignment as definite possibilities in the future. No matter what advances we see, however, the ultimate goal of personalized software systems will remain the same as they continue to evolve — allowing operators to complete their very specific tasks as efficiently and as accurately as possible.
This article was written by Jeri Reed, Associate Product Manager, Olympus Corporation (Center Valley, PA). For more information, Click Here