
An improved method of making an electronic oscillator track the frequency of an atomic-clock resonance transition is based on fitting a theoretical nonlinear curve to measurements at three oscillator frequencies within the operational frequency band of the transition (in other words, at three points within the resonance peak). In the measurement process, the frequency of a microwave oscillator is repeatedly set at various offsets from the nominal resonance frequency, the oscillator signal is applied in a square pulse of the oscillator signal having a suitable duration (typically, of the order of a second), and, for each pulse at each frequency offset, fluorescence photons of the transition in question are counted. As described below, the counts are used to determine a new nominal resonance frequency. Thereafter, offsets are determined with respect to the new resonance frequency. The process as described thus far is repeated so as to repeatedly adjust the oscillator to track the most recent estimate of the nominal resonance frequency.
The theoretical nonlinear curve is that of the Rabi equation for the shape of the resonance peak
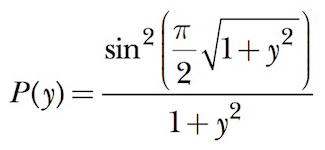
where the dimensionless variable y is related to the duration of the microwave pulse, T, and the frequency offset ν – ν0 from the atomic absorption frequency, ν0 , as follows: y= 2T(ν – ν0 ).
Assuming that the signal power has been optimized and that the photon count at a given measurement signal frequency includes a non-resonant background contribution plus a contribution attributable to the resonance, the basic measurement equation for the ith measurement is
C(i) = B + AP(y1 – ε)
where C(i) is the atomic fluorescence photon count, A is atomic fluorescence, and ε is an offset of the nominal resonance frequency from the actual resonance frequency. If measurements are made at three different oscillator frequency offsets (y1, y2, y3), then one has
C(1) = B + AP(y1 – ε)
C(2) = B + AP(y2 – ε)
C(3) = B + AP(y3 – ε)
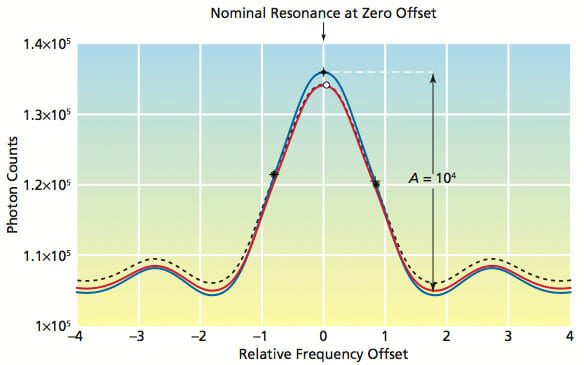
Repeatedly, for the most recent such set of three measurements (see figure), this set of three equations is inverted to extract B, A, and ε from the measurement values C(1), C(2), and C(3). Because the solution obtained through inversion of the three equations separates the influences of background light, signal strength, and the offset of the resonance from the nominal resonance frequency, unlike in a prior method, drift in the power of the lamp used to excite the clock atoms to the upper level of the transition does not seem to effect frequency pulling (that is, it does not seem to force a change in the estimate of the resonance frequency).
This work was done by John D. Prestage, Sang K. Chung, and Meirong Tu of Caltech for NASA’s Jet Propulsion Laboratory. For more information, download the Technical Support Package (free white paper) at www.techbriefs.com/tsp under the Physical Sciences category. NPO-45958
This Brief includes a Technical Support Package (TSP).
Improved Tracking of an Atomic-Clock Resonance Transition
(reference NPO-45958) is currently available for download from the TSP library.
Don't have an account?
Overview
The document is a technical support package from NASA's Jet Propulsion Laboratory (JPL) detailing advancements in atomic clock technology, specifically focusing on the 199Hg+ ion clock. This clock is being developed for potential applications in Earth orbit and deep space missions, highlighting its significance for navigation and scientific research.
The core of the document discusses a new method for tracking and steering to an atomic clock resonance transition. The resonance signal is derived from a classic Rabi single microwave square-wave pulse, with the resonance linewidth determined by the pulse duration. For instance, a 3-second microwave pulse results in a frequency linewidth of approximately 0.27 Hz. The document explains the measurement process, where the output of a tracking synthesizer is adjusted to find the line center of the resonance signal, using a sequence of fluorescence measurements to ensure accuracy.
The tracking method involves measuring the fluorescence of the ion clock at various frequencies to determine the line center, signal size, and background light level. This is achieved through a series of measurements (C(1), C(2), C(3)) that allow for the extraction of key parameters necessary for frequency stability and optimization of microwave power levels. The document also describes a non-linear curve-fit tracking algorithm used during in-lab frequency tracking, noting that frequency instabilities can occur when magnetic shields are removed.
Figures included in the document illustrate the measurement setup and the Rabi resonance lineshape, which serves as a model for the measured signal. The document emphasizes the importance of continuous optimization of microwave power for long-term autonomous clock operation, which is crucial for the reliability of the clock in various applications.
Overall, the document presents a comprehensive overview of the technical advancements in the 199Hg+ ion clock, detailing the methodologies for improving frequency tracking and stability. It underscores the potential of this technology for enhancing deep-space navigation and radio science, contributing to the broader field of aerospace technology and exploration.