
Tech Briefs: Can you give me a sense of the history of this project and how long you've been working on it?
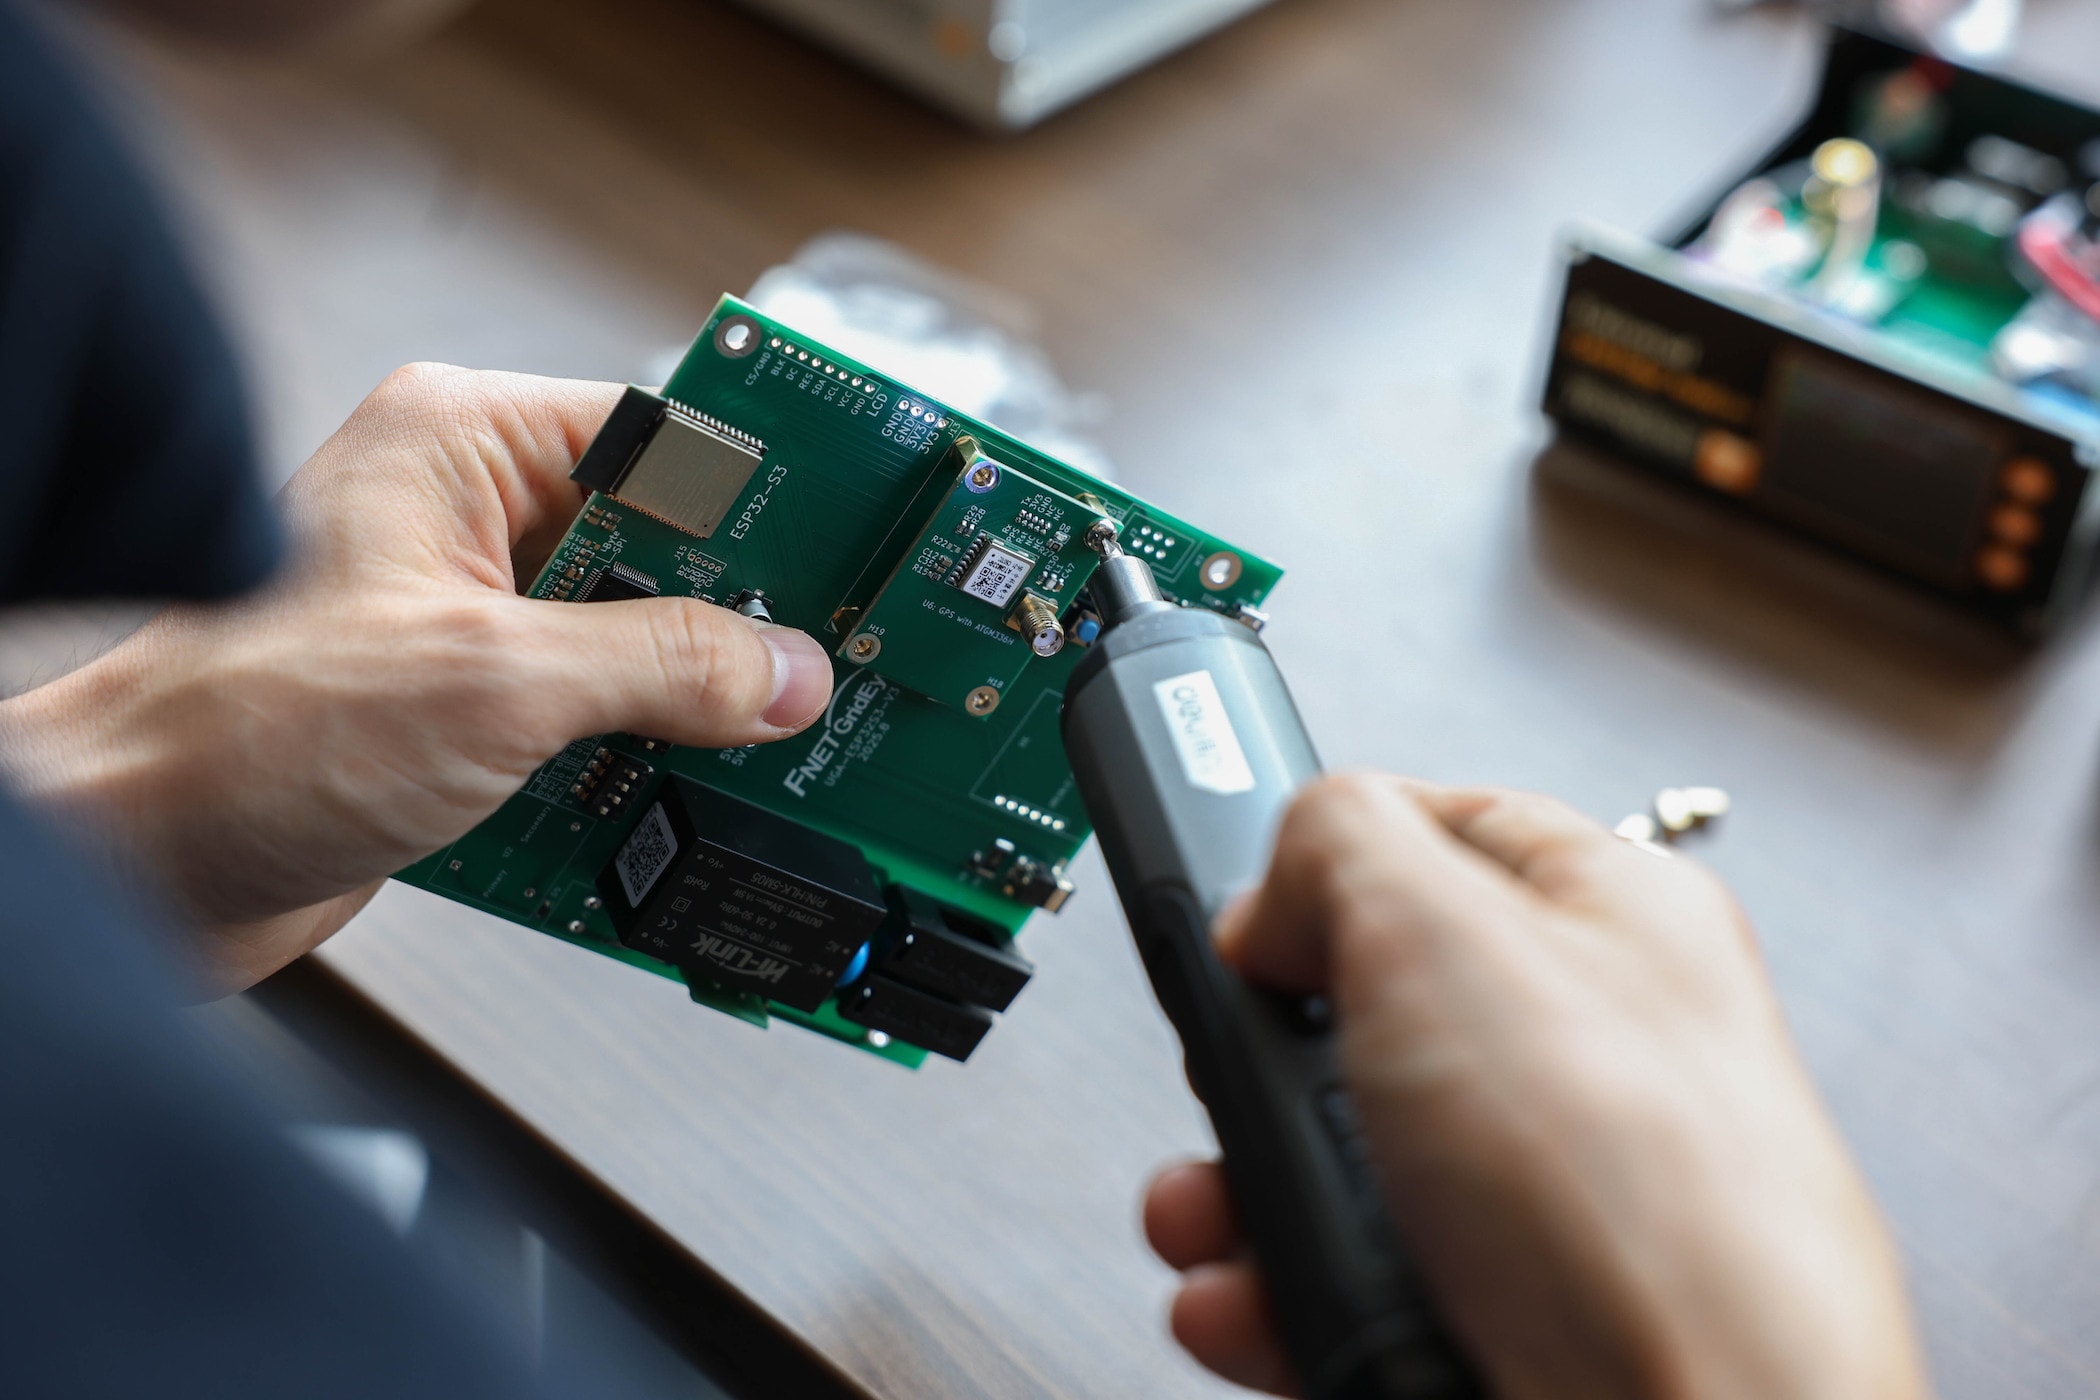
Yilu Liu: We've probably worked 20-plus years on different versions, different tools. This is the latest one — you have to change the hardware because there are constantly new and better processors, better memory. So, we improve our algorithm and design new versions. This is probably the sixth or seventh version of different monitors. And each time we add some functions.
Tech Briefs: Can you tell me about how you use your system?
Liu: We send our analyzers to hosts all over the country to monitor the grid.
Tech Briefs: Who are typical hosts?
Liu: Typically, the hosts are our students and colleagues, who are scattered all over the country, as well as volunteers who’ve seen our website, many of whom are amateur radio people and others who like to tinker.
Tech Briefs: What do you do with all that data?
Liu: The data all comes to Oak Ridge and our partners at the University of Tennessee, and we then develop applications based on it. For example, if there is a generator tripped in some location, we would collect the data, which contains time stamps and GPS locations, so we can triangulate, using the data to determine the location of the fault. We send that out to industry — on the University of Tennessee side, there is a Department of Energy/National Science Foundation-funded research center, called CURENT, that has a lot of industry affiliations. We also have industry members who receive that information from us.
Our biggest customer is NERC, the North America Electric Reliability Corporation (NERC), which is one of two entities that regulate the power industry. The other is the Federal Energy Regulatory Commission (FERC). FERC sets policy, and NERC implements it. They are the key users of our information — they want to know about large generator trips, which they study, including seeing how the system responded.
Tech Briefs: In addition to generator trips, do you see that when renewable sources like solar and wind kick in and out, they create disturbances?
Liu: Sometimes we've measured what seemed to be major generator trips, but industry told us there was no generator at that location. Then it turned out to be a solar array that tripped off due to some kind of fault. It either tripped because the voltage or frequency measurements showed that they needed to disconnect from the grid. If only one array does it, it's probably OK, but if a huge number of them are doing it at the same time, it will show up as a large generator trip.
Tech Briefs: Do you measure voltage and current waveforms?
Liu: We typically measure voltage waveforms, but current is not too relevant — the voltage waveform is where the information is.
Tech Briefs: How do you measure the waveform?
Liu: We have the box, our analyzer, which we plug in — say I take one home and plug it into my 120-volt socket.
Tech Briefs: To get a waveform does it take digital samples?
Liu: Yes, you sample the waveform, you get a digital file, you process it, and that gives you the information you need.
Tech Briefs: At what intervals do you sample?
Liu: Our latest analyzer takes 60,000 samples per second, which is 1,000 samples per cycle.
Tech Briefs: So, you use those digital samples to visualize the waveform, and then you can see when something is an anomaly?
Liu: Yes, we designed filters and triggers, so you can correlate between different monitors using the time stamp and GPS location for each measurement. You piece them together frame by frame over a large area so you can see the movement of the event.
Tech Briefs: Is the data communicated over the internet?
Liu: Yes.
Tech Briefs: I read that your work can help operators anticipate and navigate episodes. How does it help them anticipate something in advance?
Liu: For example, the standard frequency in our power systems is 60 hertz when the load and the generator are balanced. But if there’s a slight unbalance, it could be because a large load such as a data center tripped, or a large generator tripped. The frequency will deviate from 60 hertz because the rest of the system either accelerates or decelerates, which translates into the frequency going higher or lower.
But system operators don't use our data directly in real time to anticipate problems. They use it to study what a precursor could look like, but not for immediate control. Since the data comes from the internet, there are delays, but the analyzer records the whole process. The waveforms serve as a visual display of that record, like the heartbeat of a person. You use that to do your study in order to help the operator react to how certain waveforms look. Especially when you see oscillations — if the oscillation is growing, that's a very strong indicator. If it continues to grow, it could take the whole system apart.
Tech Briefs: Can you tell me more about how the oscillations indicate problems.
Liu: It depends on the type of oscillation. The ones that are caused by renewables are usually higher frequency, up to kilohertz. The ones that are typically observable across the grid usually are the lower frequencies caused by electromechanical oscillations, which are usually a fraction of a hertz.
Tech Briefs: Is there anything you’d like to add?
Liu: I think our monitor is quite important, especially because there are a lot of renewables in the power grid. In the past, we had very high reliability, 99.99 percent, partially because the system had huge inertia. It moved slowly, so people, and machines, and measurements all had time to react. But inertia comes with large power plants, so if they are gone and are replaced by fast-acting power electronics devices, things start to move extremely quickly. Then the controls, the monitors, and the other devices have to follow — it’s challenging, but interesting.
Renewable systems can reverse the power flow in a fraction of a second. In the past, we didn’t often see that, but now it’s quite common. So being able to control them is important. But to be able to control anything you have to measure it — that's why I wanted to emphasize that having good monitors widely dispersed is very important.